
Design a revenue strategy for scalable growth in 2026
Learn how to design a revenue strategy for scalable growth in 2026 with practical frameworks, essential metrics, and step-by-step execution guidance for founders.

Growth-stage businesses often generate revenue but struggle with predictable scaling, margin visibility, and structured commercial systems. Founders and commercial directors face fragmented sales efforts, inconsistent data definitions, and misaligned teams that prevent efficient revenue growth. Without a clear revenue strategy anchored in repeatable processes, companies hit growth ceilings and burn resources chasing deals with unclear ROI. This guide provides a practical roadmap to design and implement a structured revenue strategy for 2026, covering foundational frameworks, step-by-step execution, performance metrics, and troubleshooting common obstacles to help you scale revenue predictably.
Table of Contents
- Understanding The Foundations: Prerequisites For A Scalable Revenue Strategy
- Step-By-Step Execution: Designing And Implementing Your Revenue Strategy
- Tools And Metrics: How To Gain Performance Visibility And Optimize Your Revenue Engine
- Troubleshooting Common Challenges And Ensuring Consistent Revenue Growth
- How Brand Mavericks Management Can Support Your Revenue Strategy
- What Is A Growth Operating System (GOS)?
- How Can I Measure If My Revenue Strategy Is Effective?
- What Are Typical Challenges When Designing A Revenue Strategy?
- How Does Revenue Architecture Help Scale Revenue Without Adding Headcount?
Key takeaways
| Point | Details |
|---|---|
| Growth Operating System (GOS) | A GOS standardizes growth into repeatable, process-driven strategies rather than person-dependent efforts. |
| Revenue architecture layers | Strategy, data, and aligned operations form the core layers that enable predictable revenue scaling. |
| Data consistency matters | Agreed metric definitions across teams create a single source of truth for performance visibility. |
| Efficiency over headcount | Revenue architecture decouples growth from proportional headcount increases, boosting revenue per employee. |
| Track essential metrics | CAC, LTV, churn, win rates, and conversion metrics are critical for ongoing optimization and margin management. |
Understanding the foundations: prerequisites for a scalable revenue strategy
Before designing your revenue strategy, you need a solid framework that transforms growth from chaotic to systematic. A Growth Operating System (GOS) is a set of linked strategies, processes, tools, data, and rituals used to acquire, convert, and retain customers methodically. This framework shifts your business from relying on individual heroics to running on repeatable processes that scale.
The GOS consists of three core layers. The strategy layer defines your North Star Metric, key performance indicators, market positioning, and Ideal Customer Profile (ICP). Your North Star Metric represents the single metric that best captures long-term value creation, such as monthly recurring revenue or active users. KPIs break this down into measurable components like customer acquisition cost and conversion rates. Positioning clarifies how you differentiate from competitors, while your ICP identifies the exact customer segments that deliver the highest lifetime value and lowest churn.
The data layer creates a single source of truth for all teams to agree on key metric definitions and track real-time KPIs. This includes unified dashboards tracking product usage, customer acquisition cost, churn rates, and lifetime value. When sales, marketing, and customer success all reference the same data definitions, you eliminate confusion and enable accurate performance measurement. Without this consistency, teams argue over numbers instead of solving problems.
The operations layer aligns your teams around shared processes and rituals. This means standardized sales playbooks, lead scoring frameworks, onboarding sequences, and regular growth reviews. Every team member follows the same pipeline stages, uses the same qualification criteria, and reports progress using the same metrics. This standardization removes bottlenecks and makes growth predictable.
Pro Tip: Secure leadership alignment on your ICP and core KPIs before building detailed processes. Misalignment at the top cascades into wasted effort across every team.
Prerequisites for implementing a growth operating system include:
- Leadership consensus on target customer segments and value proposition
- Agreed definitions for all critical metrics like CAC, LTV, and churn
- Access to clean, centralized customer and revenue data
- Cross-functional commitment to process standardization
- Regular cadence for reviewing performance and iterating strategy
With these foundational elements defined, learn next the step-by-step process to build and execute your revenue strategy.
Step-by-step execution: designing and implementing your revenue strategy
Designing a scalable revenue strategy requires methodical execution across five critical steps that transform fragmented efforts into a structured commercial operating system.

Step 1: Define your ideal customer profile and target segments. Start by analyzing your current customer base to identify which segments deliver the highest lifetime value, lowest acquisition cost, and fastest sales cycles. Build detailed ICP criteria covering company size, industry, revenue range, technology stack, and decision-maker roles. Prioritize two to three segments where you have proven product-market fit and competitive advantage. Narrow focus accelerates revenue growth by concentrating resources on winnable deals.
Step 2: Establish positioning and clear differentiation. Articulate exactly why target customers should choose you over alternatives. Document your unique value proposition, key differentiators, and proof points like case studies or customer testimonials. Train every customer-facing team member to communicate this positioning consistently. Positioning clarity shortens sales cycles and improves win rates by making your value immediately obvious to prospects.
Step 3: Design sales pipeline stages and conversion checkpoints. Map your buyer journey from initial awareness through closed deal and renewal. Define clear entry and exit criteria for each pipeline stage like lead qualification, discovery call, proposal, negotiation, and contract signature. Establish conversion rate benchmarks for each transition. This structure lets you diagnose exactly where deals stall and optimize those specific friction points.
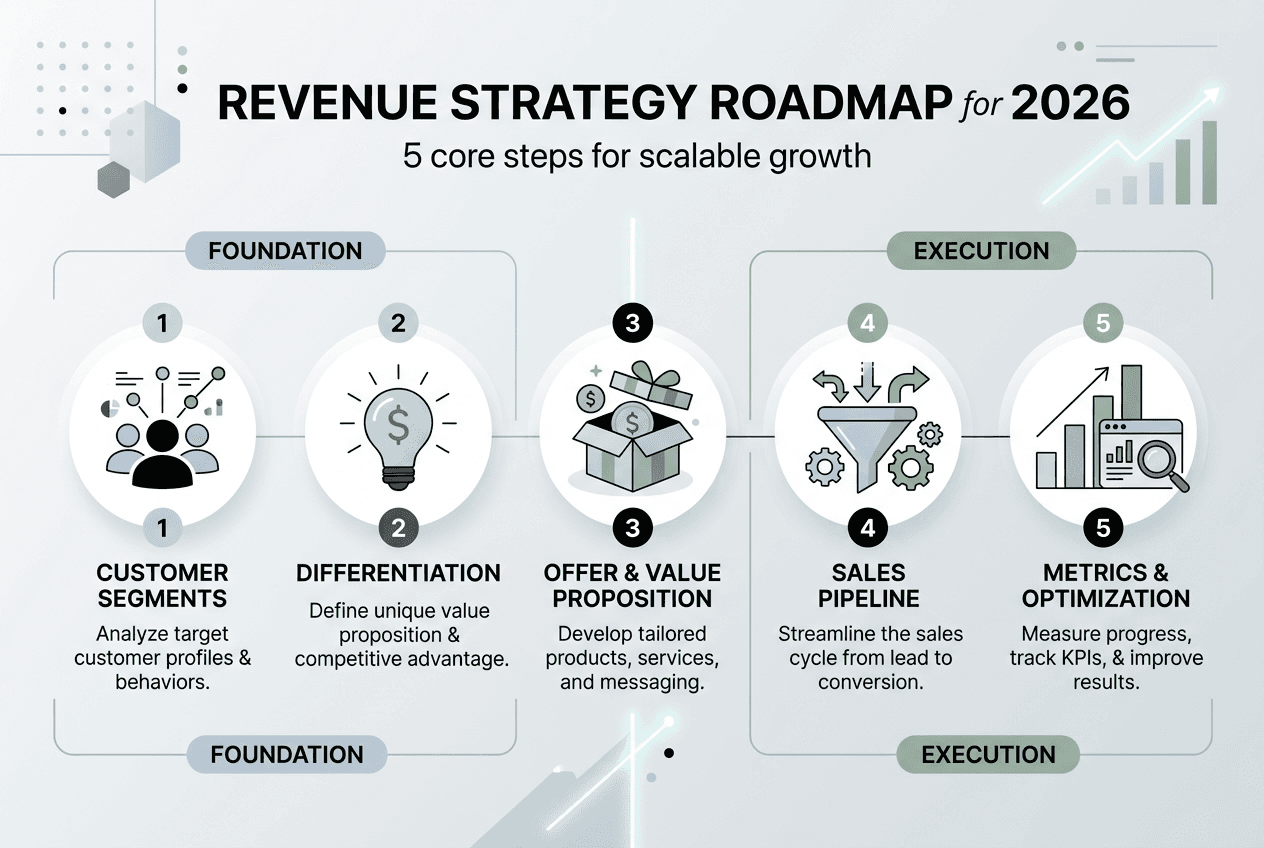
Step 4: Implement revenue architecture to increase efficiency. Revenue Architecture can decouple growth from headcount with efficiency improvements. This means optimizing your technology stack, automating repetitive tasks, and designing processes that let each team member generate more revenue. For example, self-service onboarding reduces the customer success workload per account, while automated lead scoring helps sales focus only on high-intent prospects. The revenue architecture blueprint shows how companies increase revenue per employee by 50% to 150% through these improvements.
Step 5: Align sales, marketing, and customer success operations. Break down silos by creating shared goals, unified data systems, and regular cross-functional meetings. Marketing should track not just leads but qualified pipeline and closed revenue. Sales should feed customer insights back to marketing for better targeting. Customer success should identify expansion opportunities and flag churn risks early. This alignment eliminates finger-pointing and creates a seamless customer experience.
Pro Tip: Regularly revisit your revenue architecture every quarter to refine efficiency as your business scales. What worked at $1M revenue may create bottlenecks at $5M.
After laying out how to design and launch the strategy, discover the tools to track performance and verify your strategy’s effectiveness.
Tools and metrics: how to gain performance visibility and optimize your revenue engine
Performance visibility requires tracking the right metrics with consistent definitions and real-time dashboards that surface insights across your revenue engine.
Critical metrics every growth-stage business must monitor:
- Customer Acquisition Cost (CAC): Total sales and marketing spend divided by new customers acquired in a period
- Lifetime Value (LTV): Average revenue per customer multiplied by average customer lifespan
- Churn Rate: Percentage of customers who cancel or do not renew in a given period
- Sales Cycle Length: Average days from first contact to closed deal
- Conversion Rates: Percentage of prospects advancing between each pipeline stage
- Win Rate: Percentage of qualified opportunities that result in closed deals
| Metric | Definition | Purpose | Target Range |
|---|---|---|---|
| CAC | Sales and marketing cost per new customer | Measure acquisition efficiency | Varies by industry; aim for LTV:CAC ratio of 3:1 or higher |
| LTV | Total revenue expected from average customer | Assess customer profitability | At least 3x CAC |
| Churn Rate | Percentage of customers lost per month | Track retention health | Below 5% monthly for SaaS; varies by model |
| Win Rate | Closed deals divided by total opportunities | Gauge sales effectiveness | 20-30% for enterprise; 10-20% for SMB |
| Sales Cycle | Days from lead to close | Identify process friction | Shorter is better; benchmark against peers |
Set up unified dashboards that integrate data from your CRM, marketing automation, billing system, and product analytics. The data layer’s single source of truth is critical for all teams to agree on key metric definitions and track real-time KPIs. When marketing, sales, and customer success all view the same numbers, you eliminate disputes over performance and focus energy on solving actual problems.
Consistent metric definitions prevent confusion. For example, define exactly when a lead becomes a Marketing Qualified Lead (MQL) versus a Sales Qualified Lead (SQL). Document whether churn includes only voluntary cancellations or also non-renewals. Clarify if CAC includes only direct costs or also overhead allocations. Publish these definitions in a shared document every team can reference.
Pro Tip: Use automated dashboards to surface real-time insights and quickly identify pipeline slowdowns or margin pressure points. Manual reporting delays decisions and hides problems until they become crises.
With performance visibility established, explore how to handle common challenges and avoid pitfalls when scaling your revenue strategy.
Troubleshooting common challenges and ensuring consistent revenue growth
Growth-stage companies encounter predictable obstacles when designing and scaling revenue strategies. Recognizing and solving these issues accelerates your path to predictable revenue.
Common challenges include:
- Unclear customer segmentation: Trying to serve everyone dilutes messaging and wastes resources on low-fit prospects. Solution: Ruthlessly narrow your ICP to two or three segments where you have proven success.
- Inconsistent CAC tracking: Different teams calculate acquisition costs differently, making ROI analysis impossible. Solution: Agree on one CAC formula and stick to it across all reporting.
- Low win rates: High opportunity volume but poor close rates signals weak qualification or positioning. Solution: Tighten lead scoring criteria and improve sales enablement materials.
- Pipeline inefficiencies: Deals stall at specific stages without clear reasons. Solution: Analyze conversion rates between stages to pinpoint friction and redesign those handoffs.
- Team misalignment: Sales blames marketing for bad leads while marketing blames sales for poor follow-up. Solution: Create shared revenue goals and regular cross-functional reviews.
| Ineffective Practice | Effective Practice |
|---|---|
| Each team defines metrics independently | All teams use agreed definitions from a single source of truth |
| Sales and marketing operate in silos | Unified revenue team with shared goals and regular alignment meetings |
| Manual reporting updated weekly or monthly | Automated dashboards with real-time data accessible to all stakeholders |
| Broad targeting across many customer types | Focused ICP with deep understanding of two to three high-value segments |
| Ad hoc sales processes varying by rep | Standardized playbooks and pipeline stages followed by entire team |
Without a Growth Operating System, companies may struggle to answer key questions about profitability and deal pipeline health. You might not know which marketing channels deliver the best ROI, which customer segments are most profitable, or where deals get stuck in your pipeline. Process standardization and adoption of GOS principles solve these visibility gaps.
Cross-team alignment on data and process ownership is essential. Assign clear owners for each metric and pipeline stage. Marketing owns lead generation and MQL qualification. Sales owns SQL conversion and deal closure. Customer success owns onboarding, retention, and expansion. Everyone shares responsibility for the overall revenue target.
Fixing these issues directly impacts predictable revenue growth and margin expansion. When you eliminate wasted spend on unqualified leads, shorten sales cycles through better processes, and reduce churn with proactive customer success, your revenue becomes both larger and more efficient. Companies that implement these solutions typically see 20% to 40% improvements in key efficiency metrics within six months.
Explore proven acquisition and retention strategies to further optimize your revenue engine.
Having addressed troubleshooting, next is a concise promo to support scaling your revenue strategy with professional guidance.
How Brand Mavericks Management can support your revenue strategy
Scaling revenue predictably requires more than good intentions. It demands structured commercial systems, clear performance visibility, and expert execution.
Brand Mavericks Management specializes in revenue architecture and commercial strategy for growth-stage businesses generating revenue but lacking structured systems. We design complete revenue ecosystems covering strategy, financial modeling, performance intelligence, and execution frameworks. Our services align perfectly with the Growth Operating System principles discussed in this guide, helping you define your ICP, standardize processes, unify data, and optimize margins.
Partnering with experienced consultants accelerates your path to predictable, scalable revenue by avoiding common mistakes and implementing proven frameworks from day one. Whether you need revenue strategy design, margin audits, or a full commercial operating system, we provide the clarity and control to scale efficiently. Explore our revenue strategy services to start building a stronger revenue operation today.
Finally, provide answers to frequently asked questions to address specific reader concerns and clarify concepts.
What is a Growth Operating System (GOS)?
A Growth Operating System is a collection of linked growth strategies, processes, tools, and data that create repeatable customer acquisition and retention. It transforms growth from being person-driven to process-driven by standardizing how your business attracts, converts, and retains customers. The GOS framework includes strategy layers like your North Star Metric and ICP, data layers providing unified dashboards and metric definitions, and operations layers aligning teams around shared rituals and playbooks.
How can I measure if my revenue strategy is effective?
Track metrics like Customer Acquisition Cost (CAC), Lifetime Value (LTV), churn rate, and win rates to assess strategy effectiveness. Use dashboards with consistent definitions across all teams so everyone measures performance the same way. Effective strategies show improving LTV:CAC ratios, declining churn, shorter sales cycles, and higher win rates over time. Regular reviews comparing actual performance against targets help you identify what’s working and what needs adjustment.
What are typical challenges when designing a revenue strategy?
Challenges include unclear customer segmentation that spreads resources too thin, inconsistent data definitions causing team disputes, and misaligned teams working toward conflicting goals. Many companies also struggle with low win rates from poor qualification or positioning, and pipeline inefficiencies where deals stall without clear reasons. Standardizing processes, defining metrics clearly, and creating cross-functional alignment help solve these issues and accelerate revenue growth.
How does revenue architecture help scale revenue without adding headcount?
Revenue architecture optimizes technology, process, and team alignment to boost revenue per employee significantly. It automates repetitive tasks, streamlines workflows, and removes bottlenecks so each team member generates more output. For example, Klarna achieved a 152% increase in revenue per employee through revenue architecture improvements. By decoupling growth from proportional headcount increases, you scale revenue faster while protecting margins and avoiding the chaos of rapid hiring.